EU-Atlas: Dementia & Migration
| Largest group | 2. largest group | 3. largest group | 4. largest group | 5. largest group | |
| Absolute numbers | |||||
| PwMD per 100,000 inhabitants 65+ |
| Absolute numbers | PwMD per 100,000 inhabitants 65+ | |
| Largest group | ||
| 2. largest group | ||
| 3. largest group | ||
| 4. largest group | ||
| 5. largest group |
| Prevalence per 100,000 inhabitants 65+*, calculated by country of residence | |||
|---|---|---|---|
| high > PwMD |
minor > - PwMD |
||
| increased > - PwMD |
low ≤ PwMD | ||
| medium > - PwMD |
|||
| PwMD = People with a Migration background with Dementia *Bulgarien, Litauen, Malta, Polen in der Bevölkerung 60+ |
|||
| Absolute number of PwMD 65+ | |
| PwMD per 100,000 inhabitants 65+ |
Lithuania
Lithuania does not have a long migration history. From 1940 to 1958, the country lost about one million people through expulsions, acts of war, and the Holocaust. Then, industrialization led to an influx of workers from the Soviet Union. After 1991, migration patterns changed. Previously expelled people from Lithuania returned home and the newly settled ethnic groups left the country. After the opening of the state to the West, emigration workers began. In the first years after the declaration of independence in 1990, mainly members of ethnic minorities emigrated to the Russian Federation and Ukraine. In the second half of the 1990s, there was increased emigration to Western Europe and North America. With the EU accession in 2004, the number of people from Lithuania working or studying abroad increased significantly1. Between 1990 and 2019, the migrant population (born abroad) decreased from just under 350,000 to 117,200. The proportion of migrants in the total population has declined from 9.4 to 4.2%2.
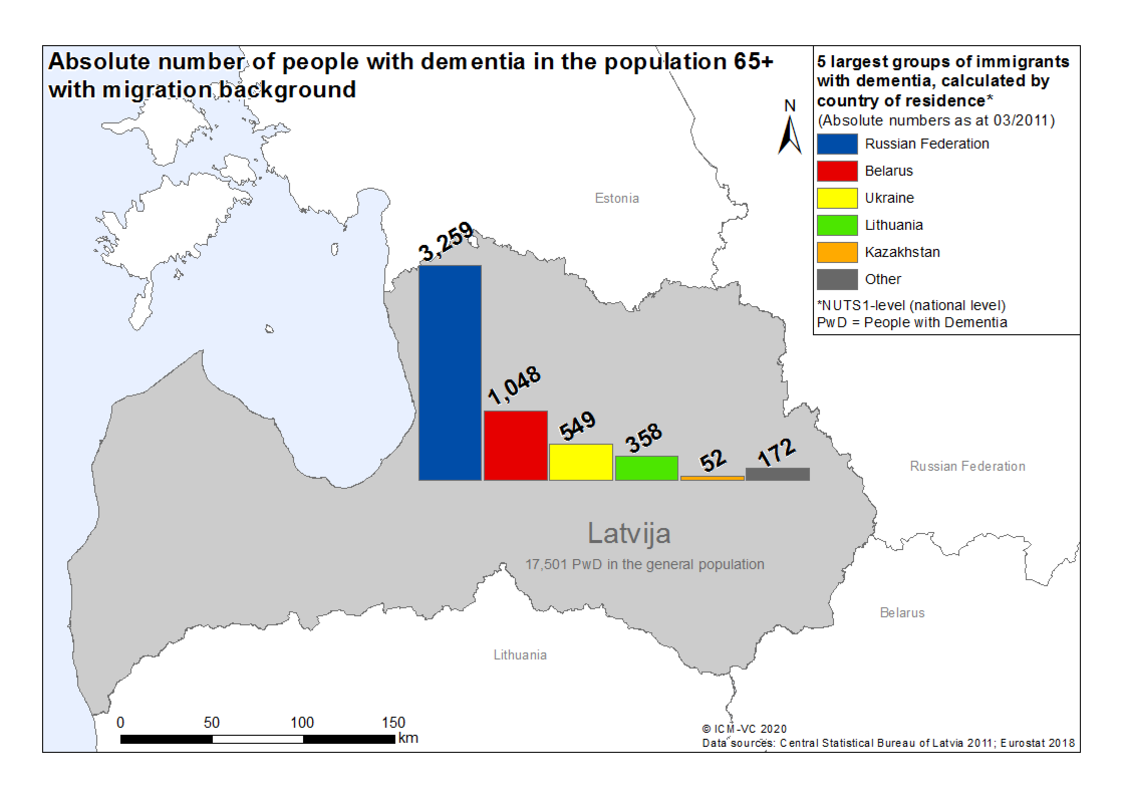
There are 70,500 people with a migration background aged 65 or older. Of those, approx. 3,200 are estimated to exhibit some form of dementia. Calculations show the most affected migrant groups presumably originate from the Russian Federation (approx. 1,400), Belarus (approx. 1,100), Ukraine (approx. 300), Poland (approx. 100), and Latvia (approx. 70)3.
For Lithuania no national dementia plan could be identified and according to a representative of the ministry of health, there are no national treatment guidelines for dementia in Lithuania4,5. These findings suggest that the topic of dementia does not play a relevant role in public policy and medical discourse in Lithuania.
References
- Brake B: Country Profile Lithuania. In. Edited by Hamburgisches WeltWirtschaftsInstitut, Bundeszentrale für politische Bildung, vol. 7; 2007.
- International Organisation for Migration: International migrant stock as a percentage of the total population at mid-year 2019; 2019.
- Statistics Lithuania: 2011 Population and Housing Census of the Republic of Lithuania. In. Vilnius: Statistics Lithuania; 2011.
- Alzheimer Europe: National Dementia Strategies: a snapshot of the status of National Dementia Strategies around Europe. [https://www.alzheimer-europe.org/Policy-in-Practice2/National-Dementia-Strategies]. (2017). Accessed 01 Jun 2019.
- Ministry of Health of the Republic of Lithuania: National treatment guidelines for dementia. In., E-Mail conversation edn; 2019.


![[Translate to Englisch:] Logo RBS [Translate to Englisch:] Logo RBS](/fileadmin/_processed_/9/7/csm_RBS_Logo_RGB_0e245a98a4.jpeg)